The premium Geographic Information System (GIS) software application ArcGIS enables handling and analyzing geographic information by visualizing geographical statistics through layer building maps. It is often used by academic institutions to develop and illustrate research in the humanities and sciences. It has, however, historically been harder to use with Apple computers. The ArcGIS online Software As a System (SAS) tool made it easier for all computer users to work with ArcGIS digital mapping tools.
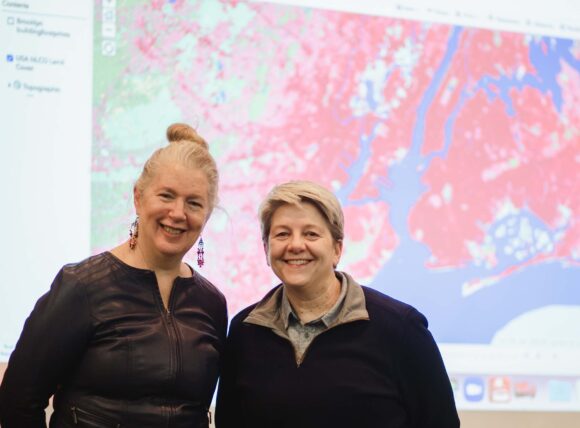
The Rutgers project team to pilot the new ArcGIS Online image tool is Hildegaard Link, assistant teaching professor and director of the SEBS Sustainability minor and Susan Oldenburg, GIS and research support specialist in the Office of Advanced Research Computing and the New Brunswick Libraries. Link and Oldenburg were selected by the ArcGIS Online for Education team to participate in a pilot program beta testing the ArcGIS Image tool.
The tool will be tested in Link’s Appraising Sustainability class that introduces students to both Geographic Information Systems and open-source GIS-based Ecosystems Services Valuation modeling applications. Link said, “We look forward to reaching a larger swath of our student population and enabling them to walk into a post graduate situation with a full, beginner GIS experience.”
The ArcGIS online pilot program team selected a few universities to test ArcGIS Image for ArcGIS Online usage (pattern of use), type of analysis, performance, user experience and credit consumption.
GIS tools work with two basic types of data: Vector and Raster*. Earlier versions of the ArcGIS online tool allowed only manipulation of Vector data. The new Image tool enables manipulation of Raster data sets also. Link said, “This new tool lets students/users work with both key types of GIS data online and opens broad opportunities for undergraduate GIS learning beyond the traditional computer lab setting.”
Link is a civil engineer licensed in New York State. Her areas of interest and expertise are water and energy systems operation in the context of climate change and facilitating collaborative decision making in high climate risk urban areas. Oldenburg is passionate about data, mapping, and making GIS tools accessible to researchers. Prior to coming to Rutgers, she served in a similar role at the Northwestern University Libraries and and a graduate GIS certification from Northeastern Illinois University.
*Vector data: consisting of individual points, (for 2D data) stored as pairs of (x, y) co-ordinates. All vector data fundamentally consists of lists of co-ordinates that define vertices, together with rules to determine whether and how those vertices are joined.
Raster data: A representation of the world as a surface divided into a regular grid of cells or pixels. Raster data is useful for storing data that varies continuously, as in aerial photographs, satellite images, hydrologic flow nets or elevation surfaces.


